Overview
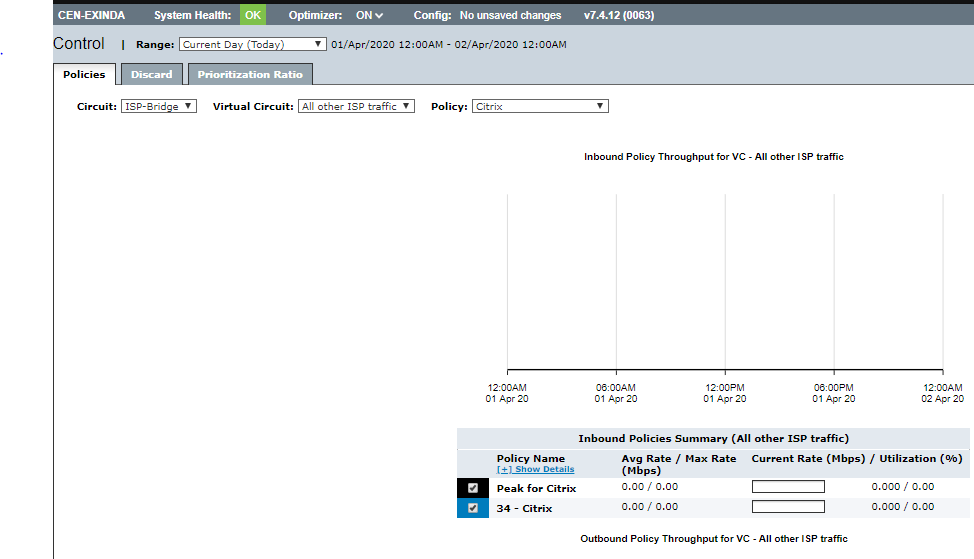
When navigating to Monitor> Control> Policies to access the Policies graph, you may experience an issue where the graphs on Exinda are blank (see below),
Solution
This error may occur when the daemon is not connected to the mysqld process.
Try first restarting the Database and then, if needed, Monitoring services.
Restart the database using the following commands:
  en
  conf t
  service database restart
The database will change from 'starting' to 'running,' and graphs should start appearing. If the database is showing 'running' and graphs are still not displayed after 10 minutes, proceed to restart the monitor using the below commands:
  en
  conf t
  service monitor restart
Restarting of these services will not impact the traffic flow.
Testing
Navigate back to Monitor>Control>Policies and confirm the graphs are no longer blank.
Priyanka Bhotika
Comments